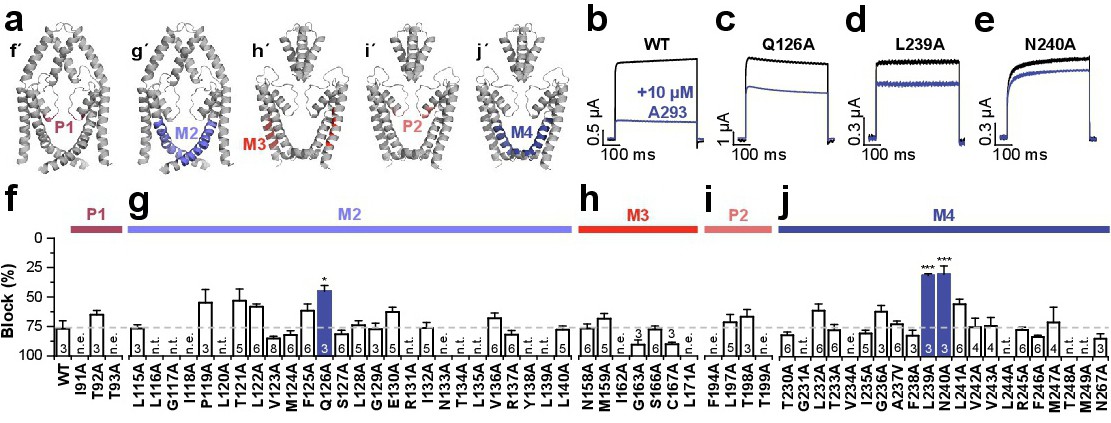
Fig. 2. Alanine-scan to identify the A293 binding site in TASK-1. (a) Amino acids or regions subjected to alanine scanning mutagenesis are displayed in different colors for the different domains, f´ for the P1 (pore forming loop 1) pore signature sequence, g´ for the M2 (transmembrane domain 2) segment, h´ for the M3 (transmembrane domain 3) segment, i´ for the P2 (pore forming loop 2) pore signature sequence and j´ for the M4 (transmembrane domain 4) segment. A TASK-1 homodimer consisting of only M1, P1 and M2 domains where M3, P2 and M4 domains are omitted for clarity is displayed in f' and g'. Homodimers of TASK-1 channels consisting of only M3, P2 and M4 domains where M1, P1 and M2 domains have been omitted are displayed in h'-j'. (b-e) Representative currents of TASK-1 WT and mutant channels before (black) and after the application of 10 µM A293 (blue). (f-j) Inhibition of TASK-1 pore mutant channels by 10 µM A293 is displayed, compared to TASK-1 WT channels (dashed line). Data are given as mean ± S.E.M.. * p<0.05, *** p<0.001.